What is this?
A record of Henry Wong's demo trades in the "Rent-Collection Group". Students who enrol in any Option Landlord Masterclass course (Foundation / Intermediate / GP) can take part, watching how the instructor actually opens positions, adjusts and deploys — learning from real cases.
Disclaimer: trades are shared in the group on a delayed basis, for learning purposes only — they are not investment tips, not real-time signals, and students should not copy-trade.
What was done?
With no clear direction in January and February 2025, no positions were opened; from March to October conditions were right, and using the Calendar Spread taught in the Foundation class, the group "collected rent" 25 times on SPX500 index options — most trades completed within 2 to 7 trading days.
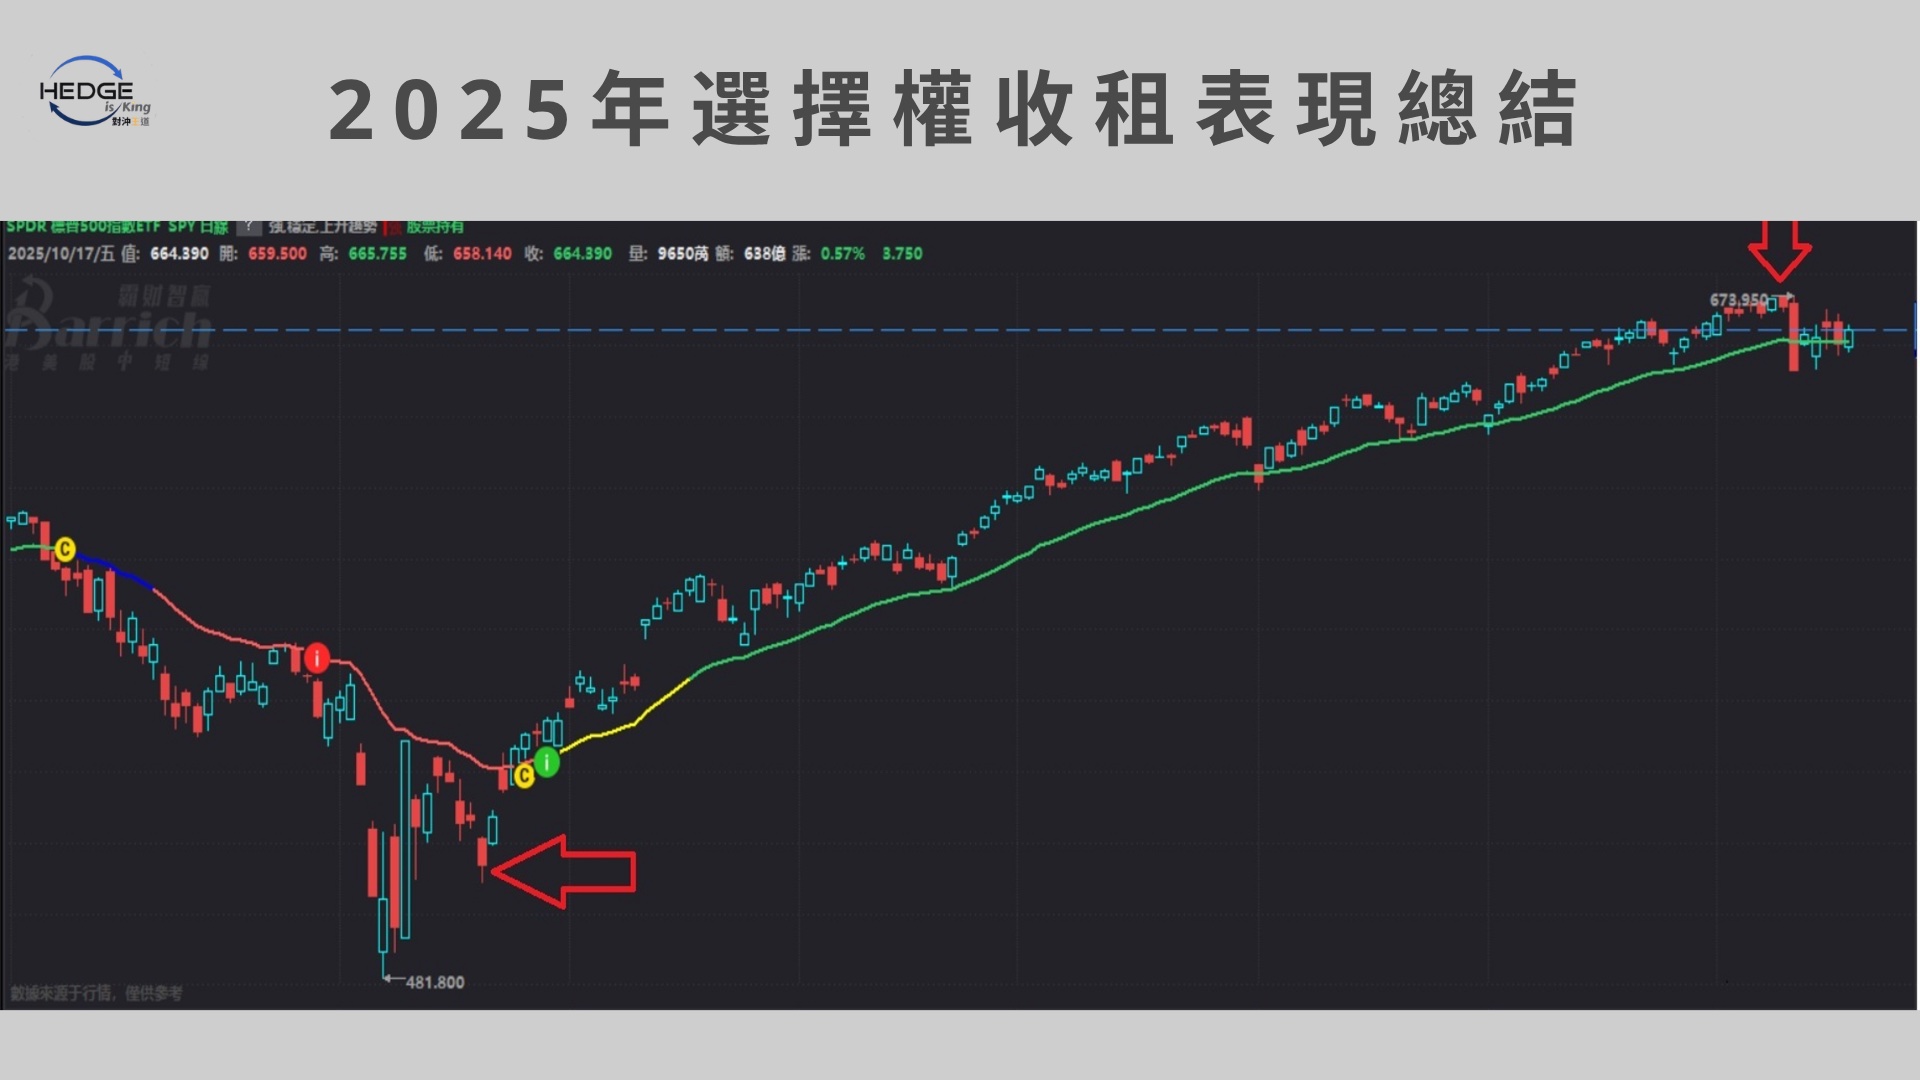
Below are all 25 trades, listed one by one — what was paid, what was received, and the profit or loss — including 1 break-even and 2 losses, disclosed in full:
| Open date | Premium paid (USD) | Close date | Premium received (USD) | P/L (USD) | Return |
|---|---|---|---|---|---|
| 4 Mar | -1.88 | 6 Mar | +2.38 | +0.5 | +27% |
| 11 Mar | -2.87 | 13 Mar | +3.46 | +0.59 | +21% |
| 14 Mar | -1.85 | 21 Mar | +3.05 | +1.2 | +64% |
| 21 Mar | -2.18 | 28 Mar | +4.20 | +2.02 | +93% |
| 28 Mar | -1.50 | 3 Apr | +2.86 | +1.36 | +90% |
| 9 Apr | -1.80 | 10 Apr | +2.00 | +0.2 | +11% |
| 10 Apr | -2.04 | 16 Apr | +3.50 | +1.46 | +72% |
| 16 Apr | -2.00 | 21 Apr | +2.58 | +0.58 | +29% |
| 21 Apr | -2.58 | Expired | 0 | -2.58 | -100% |
| 24 May | -1.96 | 29 May | +2.46 | +0.5 | +25% |
| 9 Jun | -1.47 | 11 Jun | +2.00 | +0.53 | +36% |
| 11 Jun | -1.34 | 12 Jun | +1.35 | +0.01 | 0% |
| 7 Jul | -1.75 | 9 Jul | +2.19 | +0.44 | +25% |
| 11 Jul | -1.60 | 17 Jul | +2.30 | +0.7 | +44% |
| 28 Jul | -12.75 | 31 Jul | +13.75 | +1 | +8% |
| 11 Aug | -11.45 | 12 Aug | +16.35 | +4.9 | +43% |
| 18 Aug | -15.60 | 22 Aug | +20.60 | +5 | +32% |
| 25 Aug | -14.40 | 28 Aug | +21.40 | +7 | +49% |
| 29 Aug | -14.85 | 4 Sep | +19.00 | +4.15 | +28% |
| 4 Sep | -14.75 | 9 Sep | +20.75 | +6 | +40% |
| 17 Sep | -14.75 | 19 Sep | +20.75 | +6 | +40% |
| 20 Sep | -19.50 | 30 Sep | +23.00 | +3.5 | +18% |
| 30 Sep | -16.40 | 3 Oct | +22.60 | +6.2 | +38% |
| 7 Oct | -17.00 | 9 Oct | +22.10 | +5.1 | +30% |
| 9 Oct | -16.75 | 13 Oct | +9.20 | -7.55 | -45% |
Premiums are quoted in SPX500 index points; return = P/L ÷ premium paid.
What was the result?
Both losses (-100% and -45%) are listed in the table exactly as they happened — losing rarely, with the loss amount budgeted in advance, is the very core of this method.
What can you learn?
- No clear direction, no new positions — in January and February it was better to wait in cash
- The power of rent collection lies in repetition: small wins that keep compounding beat one big gamble
- The group continues in 2026 — see the latest 2026 record →